Walmart is one of the top USA e-commerce retailers. In 2016, they were the second after Amazon by sales.
In e-commerce, the conversion is directly affected by how fast the site loads. For many e-commerce companies, making the site faster by 1 second increased the conversion 1.05, 1.1, or even 1.2 times. That’s because the slower the site, the more users abandon it before it loads, and the lesser is the conversion.
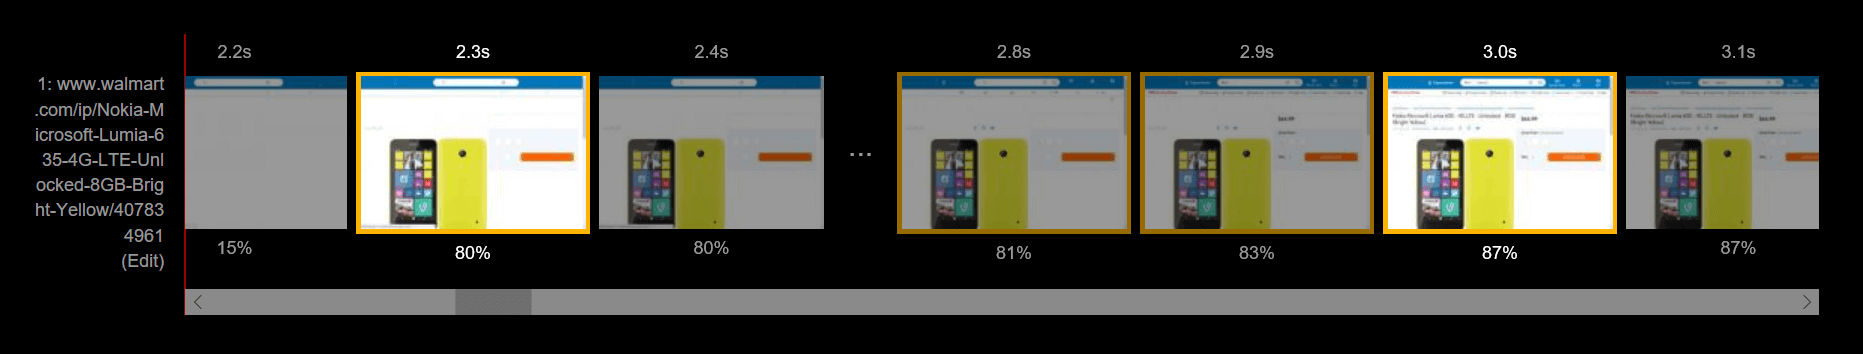
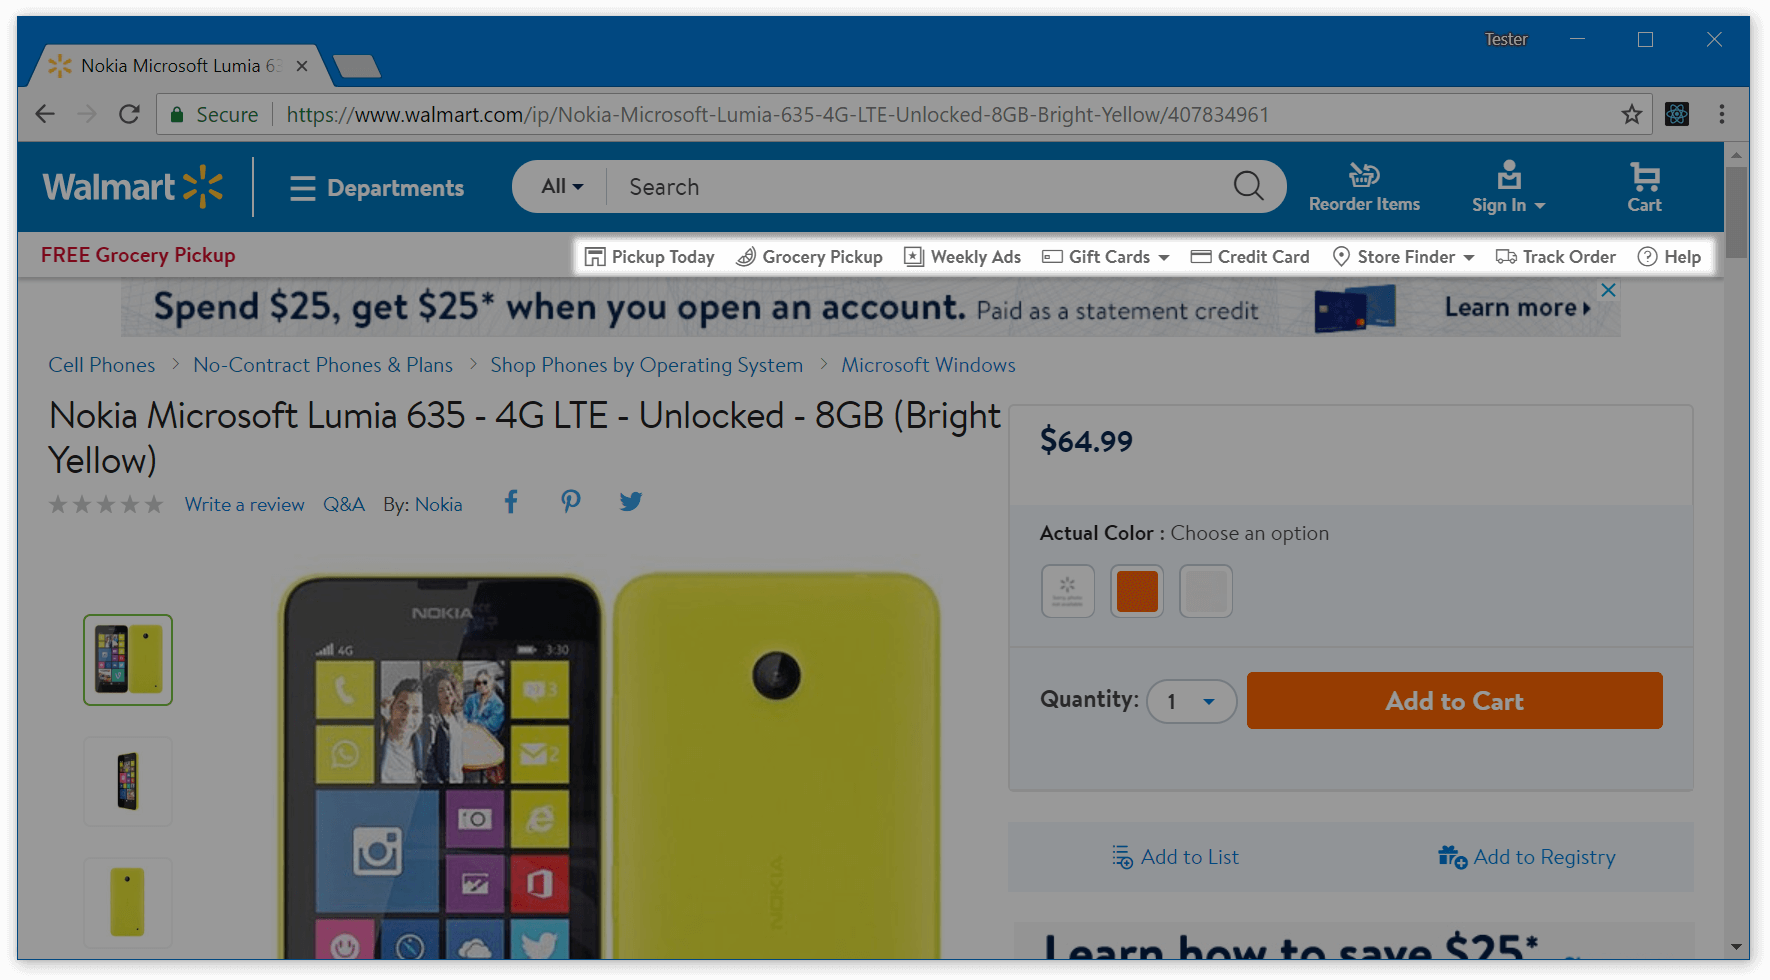
Unfortunately, the Walmart site is pretty slow. In my tests, the content of the product page becomes visible only at the third second:

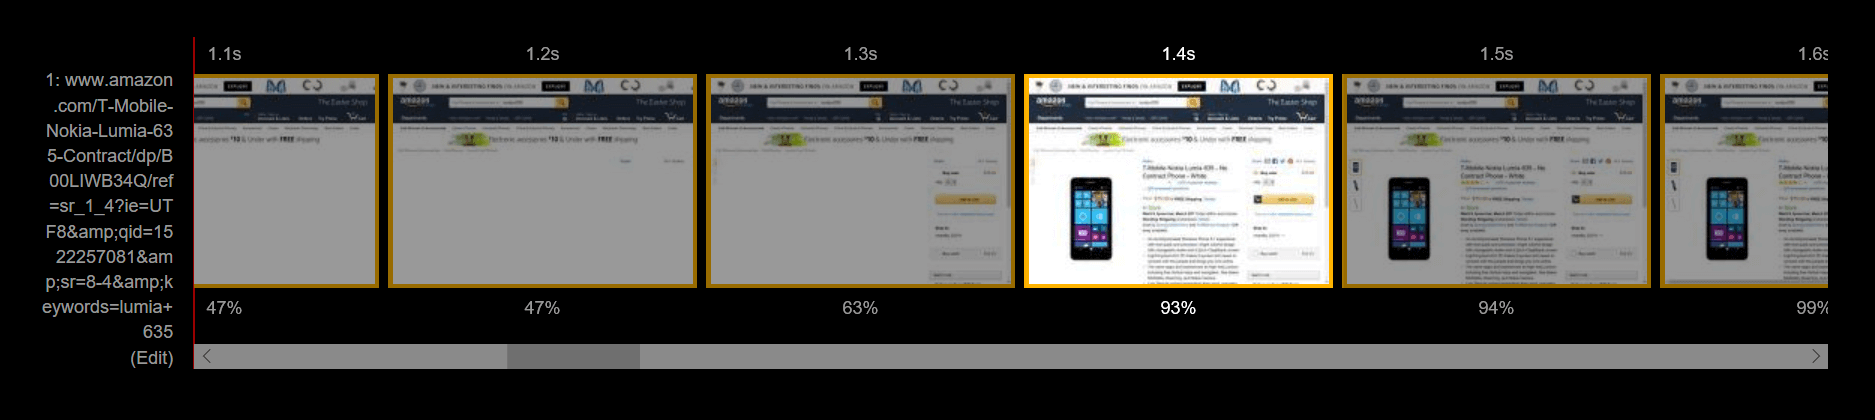
In comparison, for Amazon, the content gets visible at 1.4 seconds. The customer sees the product they came for twice faster!
Let’s analyze the Walmart’s site and see how we can improve the performance – and help Walmart earn more! I’ll use the Lumia 635 product page as an example.
Fix the invisible text#
The first issue with the page is that it gets more or less rendered at 2.3s, but the text isn’t visible until 3.0s:
This happens because Walmart uses a custom font, and by default, Chrome and Firefox won’t render the text until the font is loaded. This is how it looks live:
See how the page stays without the text for a second?
(Network throttled with the “Fast 3G” preset in Chrome DevTools)
Browsers delay rendering the text to prevent a flash of unstyled text (FOUT). However, this makes the content invisible for longer – and likely decreases the conversion!
To change this behavior, we can add the font-display: optional rule to the @font-face styles. font-display controls how the custom font is applied. In our case, it tells the browser to just use a fallback font if the custom one is not cached:
/* https://ll-us-i5.wal.co/.../BogleWeb.css */
@font-face {
font-family: "BogleWeb";
/* ... */
font-display: optional;
}
Now, when a customer visits the page for the first time, they will see the text immediately, rendered in a fallback font. The browser will download the custom font in the background and use it for subsequent pages. The current page won’t get the custom font – this prevents the FOUT:
Now the text is visible immediately.
(Network throttled with the “Fast 3G” preset in Chrome DevTools. The CSS file was substituted with Fiddler)
Side note: single-page apps#
With font-display: optional, the font won’t be applied until the user reloads the page. Keep this in mind if you have a single-page app: navigating across routes there won’t make the font active.
Optimize JavaScript#
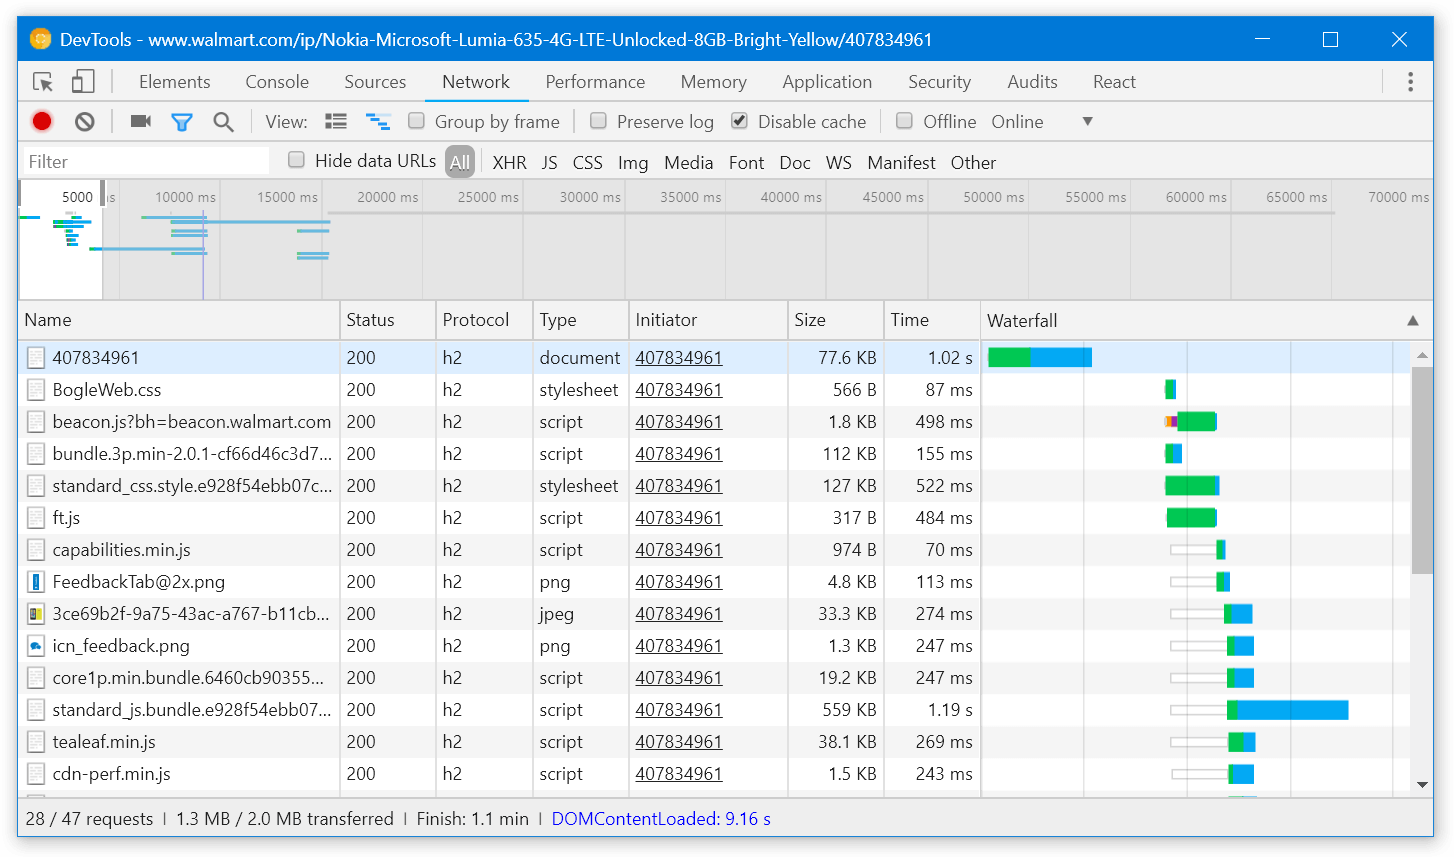
Another issue is that the page downloads around 2 MBs of gzipped JavaScript. That’s a lot:
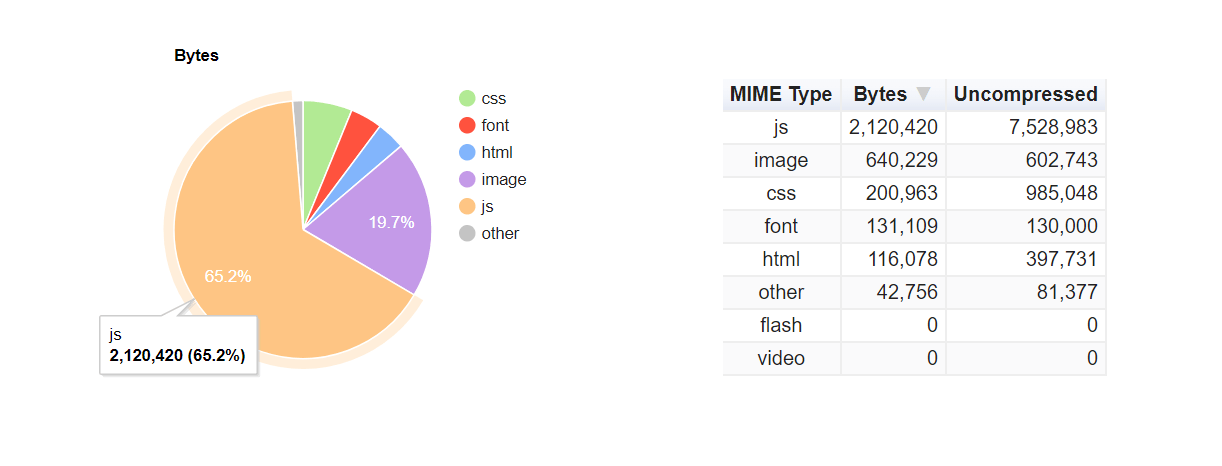
JavaScript code is minified, so I’m only able to analyze it on the surface. Here’s what I found.
Use defer for the first bundle#
Most of <script> tags on the page have either the async or the defer attribute. This is good because the browser can render the page not waiting for these scripts to download:
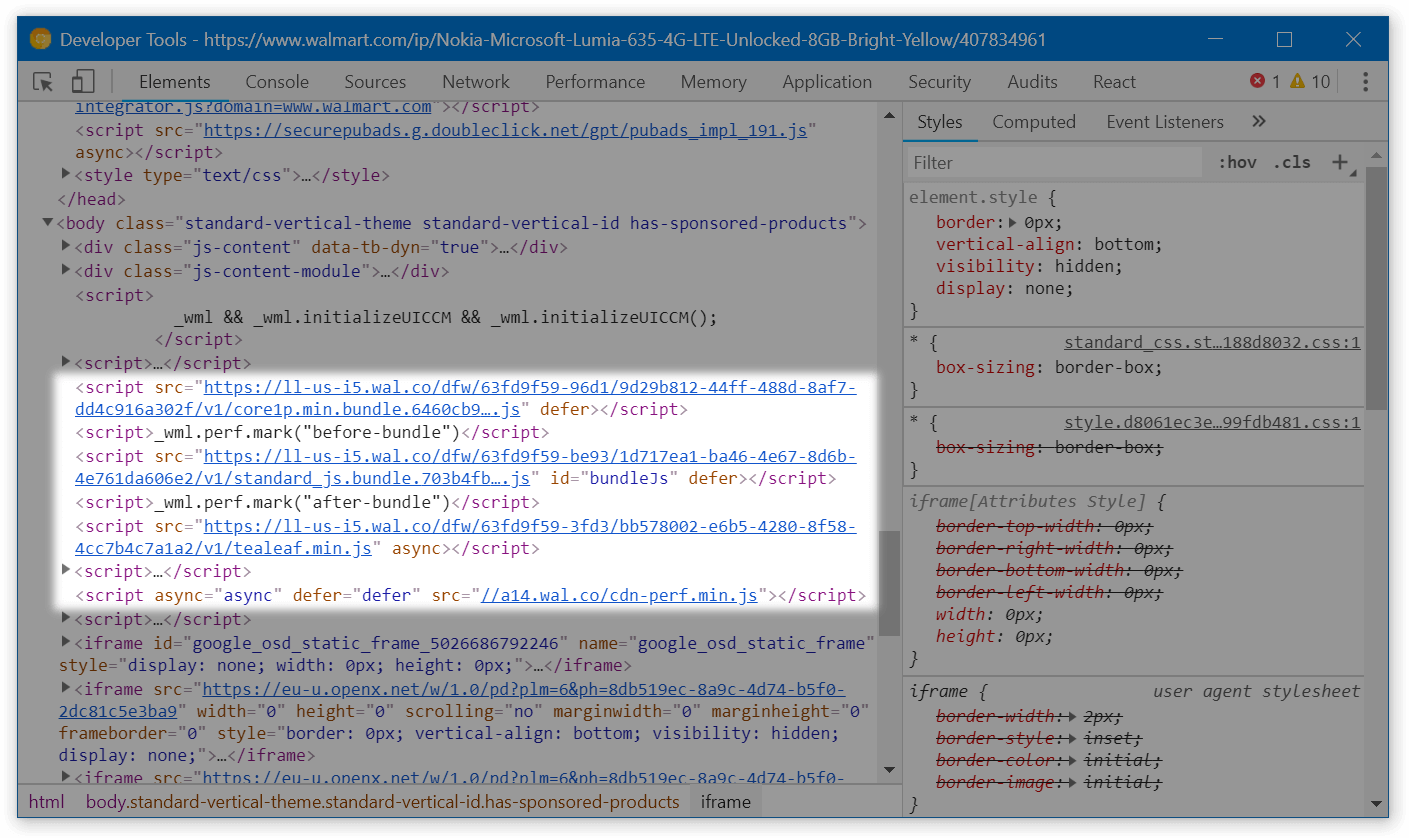
However, one large file – bundle.3p.min-[hash].js, 112.3 kB gzipped – doesn’t have either of these attributes. If it takes a while to download (e.g., the customer is on a bad connection), the page will stay blank until the script is fully loaded. Not cool!
To solve this, add the defer attribute to this script tag too. As soon as all JavaScript that relies on bundle.3p.min-[hash].js is also deferred (which seems to be the case), the code will keep working fine.
Side note: performance marks#
In the screenshot above, there’s code that likely measures the time the bundle takes executing:
<script>_wml.perf.mark("before-bundle")</script>
<script src="https://ll-us-i5.wal.co/dfw/[hash]/v1/standard_js.bundle.[hash].js" id="bundleJs" defer></script>
<script>_wml.perf.mark("after-bundle")</script>
This code doesn’t work as expected: because of defer, the bundle executes after both of these inline scripts. Just in case somebody from Walmart is reading this.
Load non-important code only when necessary#
Chrome DevTools have the “Coverage” tab that analyzes how much CSS and JS is unused. If we open the tab, reload the page and click around a bit to run the most important JavaScript, we’ll see that around 40-60% of JS still hasn’t executed:
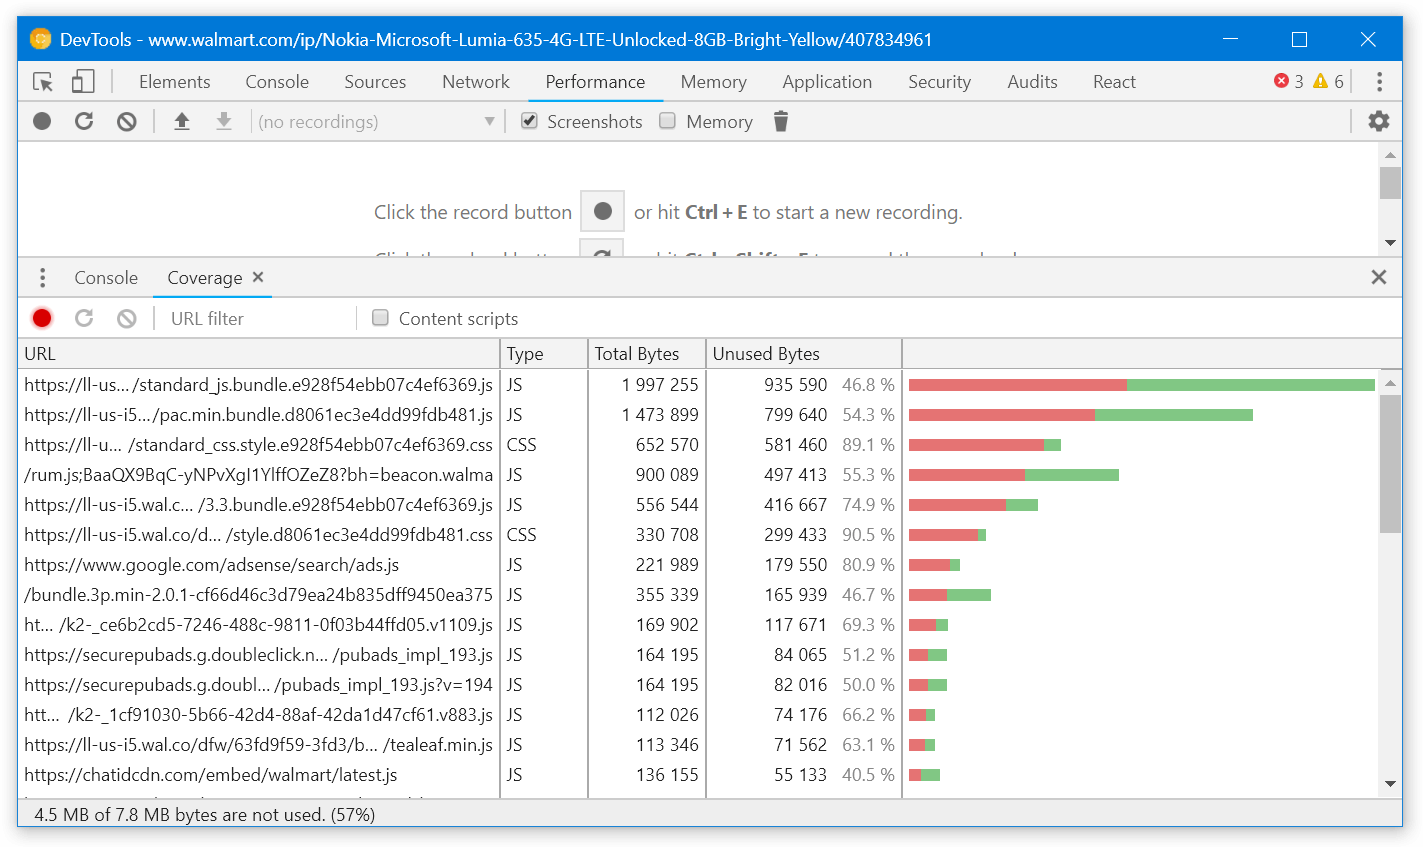
This code likely includes modals, popups and other components that aren’t rendered straight when the customer opens the page. They are a good candidate to be loaded only when actually needed. This might save us a few hundred kBs of JS.
This is how you load components dynamically with React and webpack:
import React from 'react';

class FeedbackButton extends React.Component {
handleButtonClick() {
// ↓ Here, import() will make webpack split FeedbackModal
// into a separate file
// and download it only when import() is called
import('../FeedbackModal/').then(module => {
this.setState({ FeedbackModal: module.default });
});
}

render() {
const FeedbackModal = this.state.FeedbackModal;

return <React.Fragment>
<button onClick={this.handleButtonClick}>
Provide feedback!
</button>
{FeedbackModal && <FeedbackModal />}
</React.Fragment>;
}
};
Don’t serve babel-polyfill in modern browsers#
If we look into standard_js.bundle.[hash].js, we’ll notice that it includes babel-polyfill:
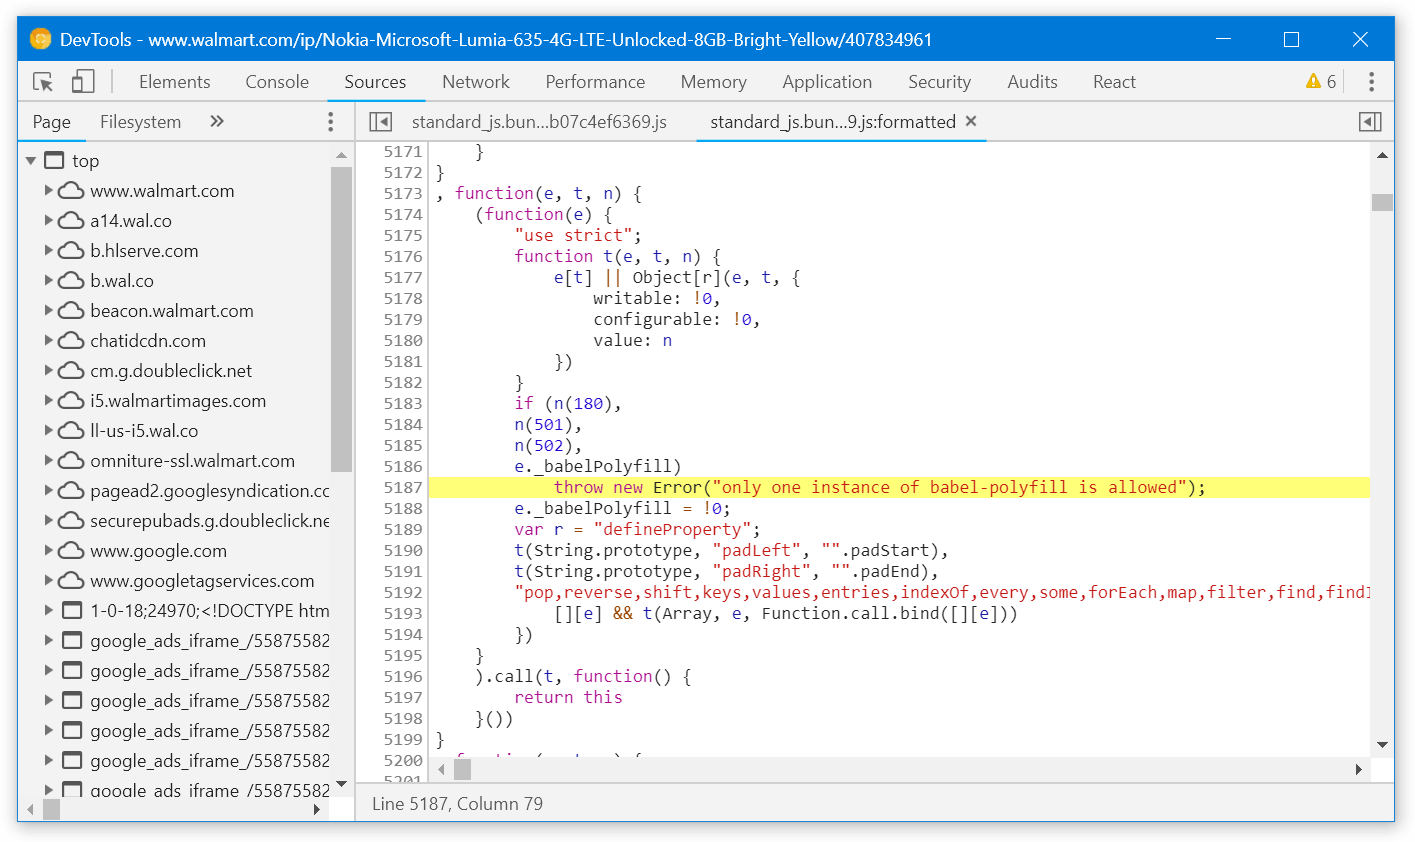
babel-polyfill weights 32.9 kB gzipped and takes 170 ms to download on Fast 3G:
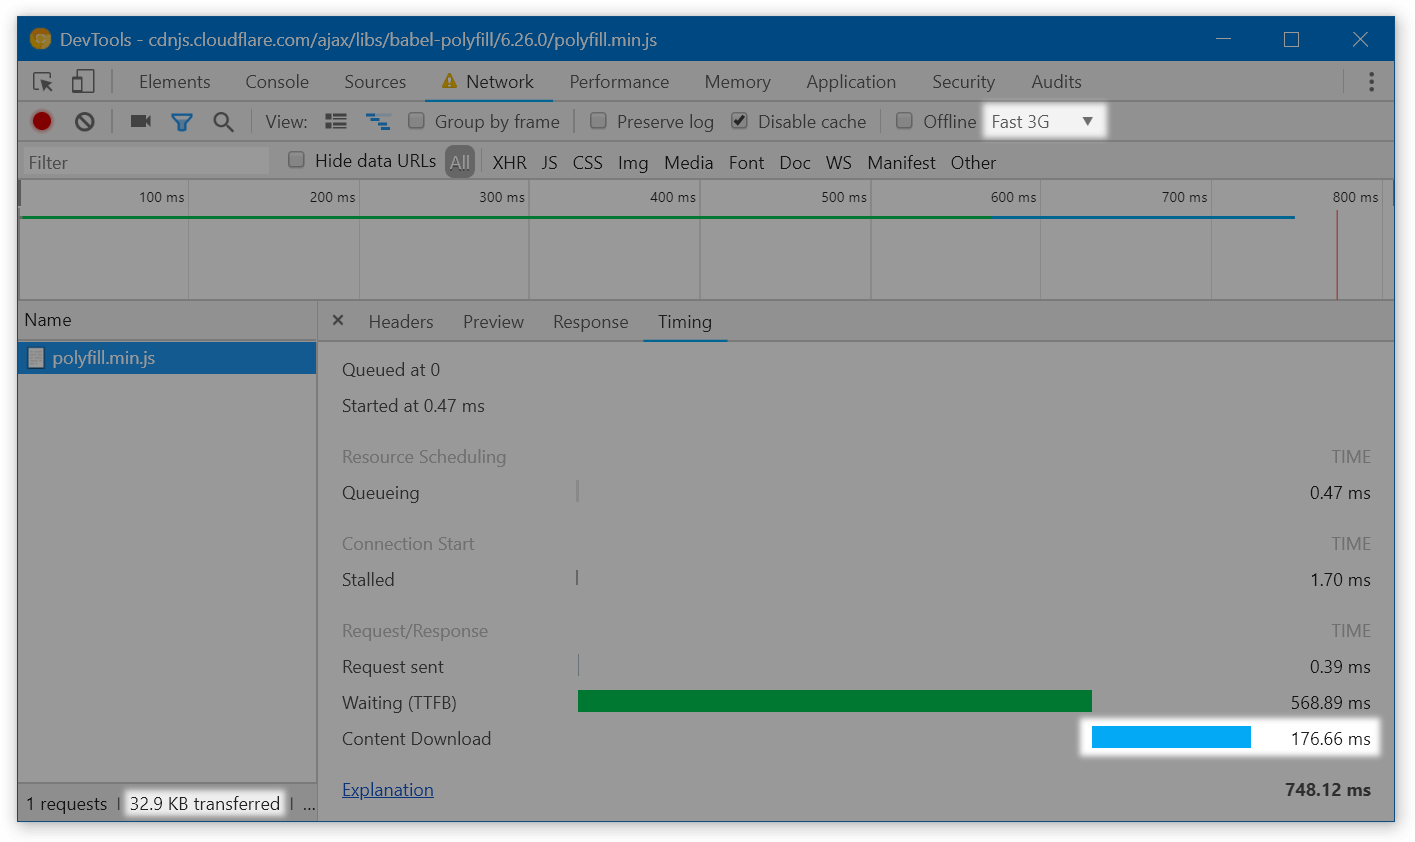
By not shipping this polyfill in modern browsers, we could make the page fully interactive 170 ms earlier! And this is fairly easy to do:
- either use an external service that serves polyfills based on
User-Agent, like polyfill.io, - or build a second bundle without polyfills and serve it using
<script type="module">, like in the Philip Walton’s article.
Don’t load polyfills multiple times#
Another problem is that the Object.assign polyfill is served in 3 files simultaneously:
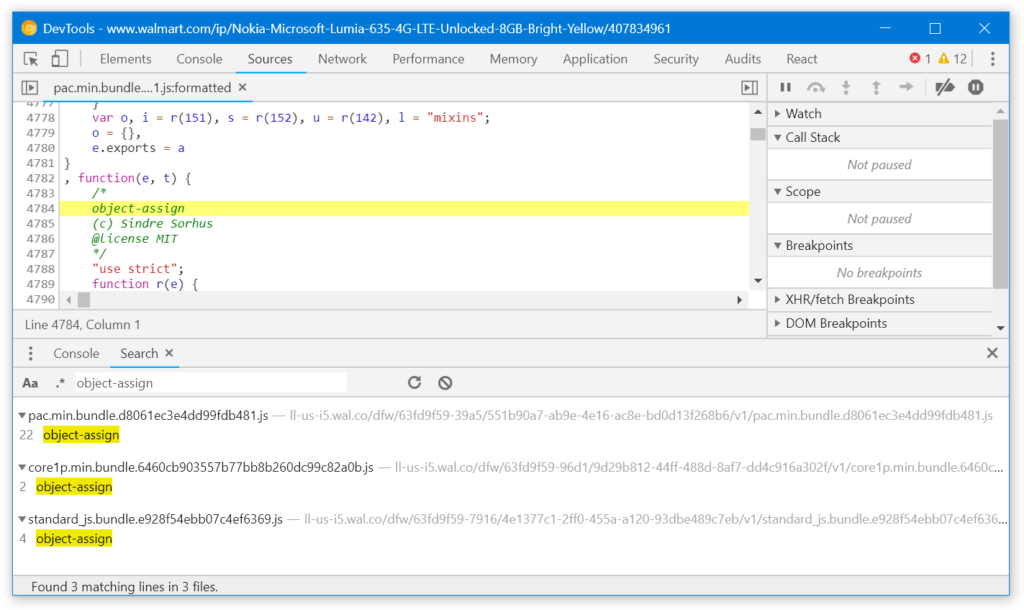
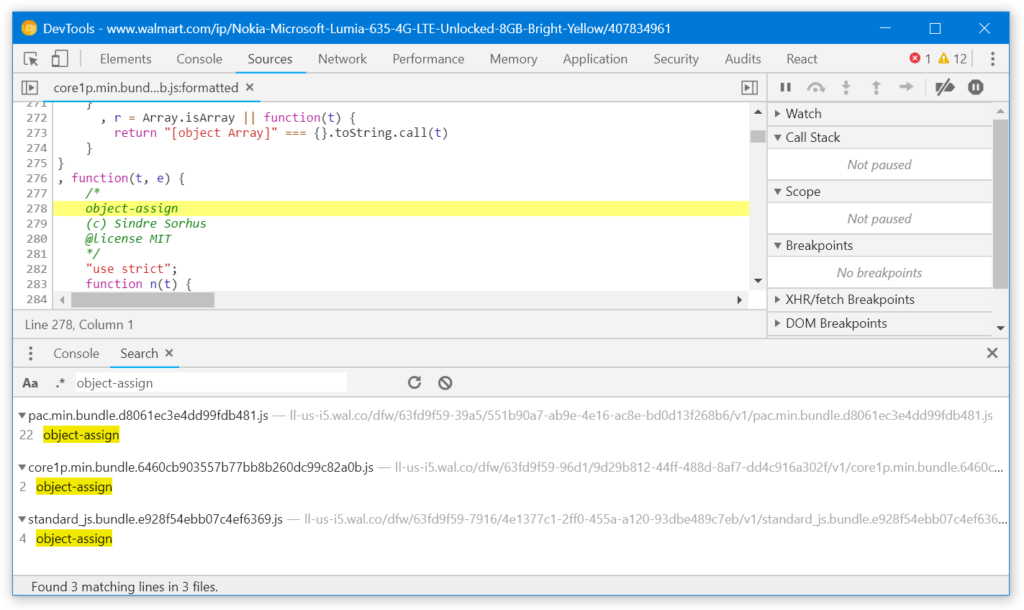
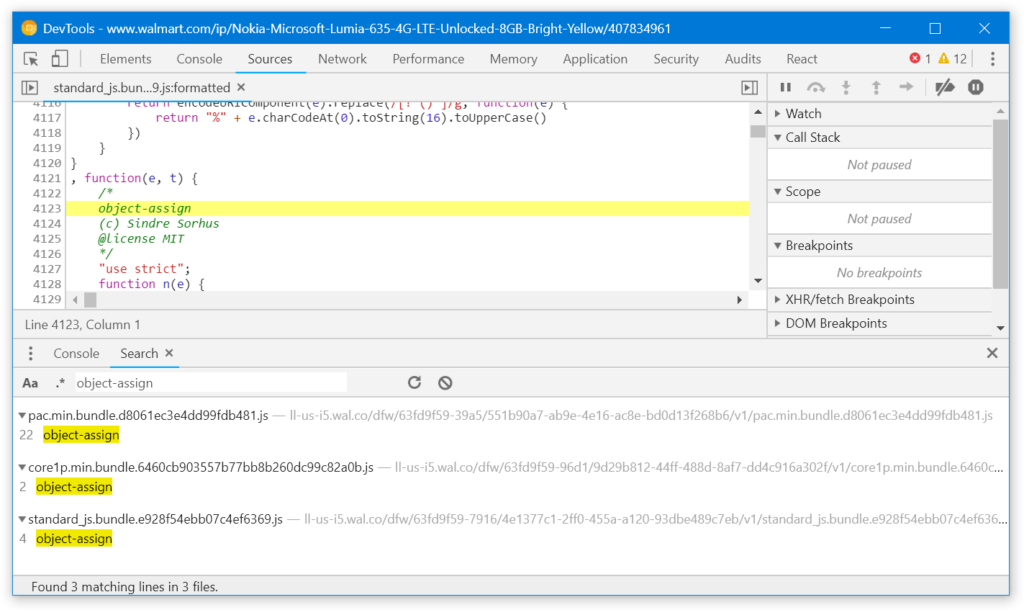
The polyfill is small on its own, but this might be a sign that more modules are duplicated across the bundles. I’d try looking into that if I had access to sources.
Remove Node.js polyfills#
By default, webpack bundles polyfills for Node.js-specific functions when it sees them used. Theoretically, this is useful: if a library relies on setImmediate or Buffer which are only available in Node.js, it will still work in a browser thanks to the polyfill. In practice, however, I’ve seen the following happen:
// node_modules/random-library/index.js
const func = () => { ... };

if (typeof setImmediate !== 'undefined') {
// ↑ Webpack decides that `setImmediate` is used
// and adds the polyfill
setImmediate(func);
} else {
setTimeout(func, 0);
}
The library is adapted to work in the browser, but because webpack sees that it references setImmediate, it bundles the polyfill.
Node polyfills are small (a few kBs minified), so removing them usually doesn’t make sense. Still, it’s a good candidate to optimize if we were squeezing the last milliseconds from the page. Removing them is super easy (but needs to be tested – what if some code really needs them?):
// webpack.config.js
module.exports = {
node: false,
};
Decrease the render-blocking CSS#
Apart from JS, page rendering is also blocked by CSS. The browser won’t render the page until all CSS (and JS) files are downloaded.
The Walmart page initially depends on two CSS files. In my tests, the largest of them takes even longer to download than the JS bundle – so it blocks rendering even after the script got downloaded and executed:

How to solve this? We can go the way Guardian went in 2013:
- Find the critical CSS and extract it into a separate file. “Critical” means “The page looks funny without it”.
Tools like Penthouse or Critical might be useful here. I’d also tune the result manually to exclude content that’s above the fold but is not very important (e.g., header navigation):
We can show this a couple seconds later in exchange for faster overall rendering - When serving the initial HTML, only load the critical CSS.
- Once the page is more or less downloaded (e.g., when the
DOMContentLoadedevent happens), dynamically add the remaining CSS:document.addEventListener('DOMContentLoaded', () => { const styles = ['https://i5.walmartimages.com/.../style.css', ...]; styles.forEach((path) => { const link = document.createElement('link'); link.rel = 'stylesheet'; link.href = path; document.head.appendChild(link); }); });
If we get this right, we’ll be able to render the page several hundred milliseconds earlier.
Remove duplicated styles#
In total, the Walmart page downloads three CSS files: one with the font definitions (BogleWeb.css) and two with the app styles (standard_css.style.[hash].css and style.[hash].css). The latter two seemed pretty similar, so I removed all the content except selectors and tried to compare the files.
Guess what? There’re 3400 common selectors among these files – and these selectors mostly have common styles! For the perspective, the first file has around 7900 selectors total, and the second one has around 4400:
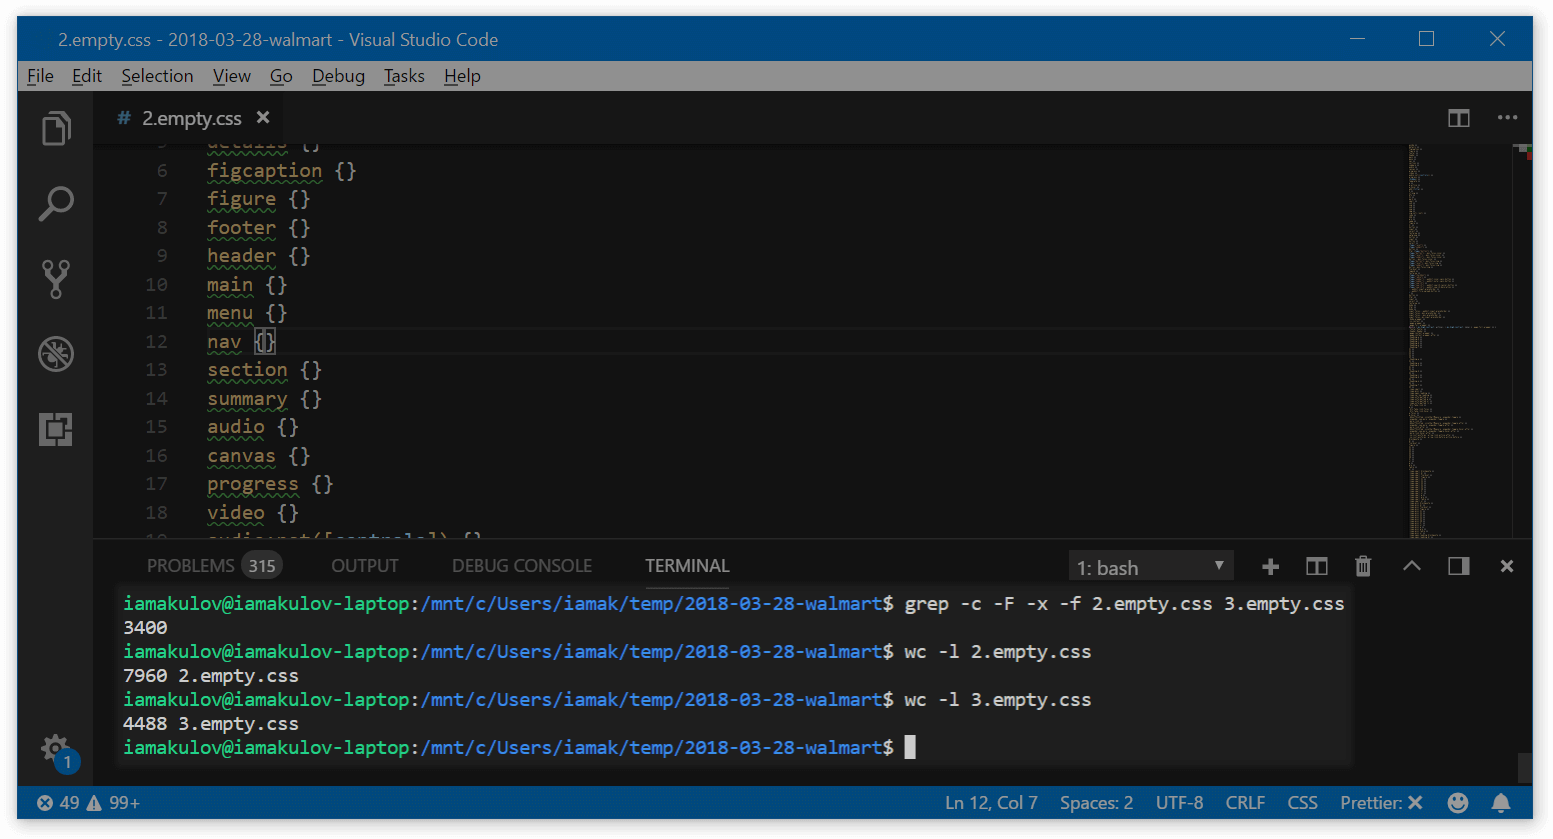
grep command is from StackOverflowThat’s a good area to optimize. This won’t affect time to first paint if we decrease the render-blocking CSS properly, but these CSS files will still load faster!
Add a service worker to cache assets#
The Walmart site is not a single-page app. This means that, on different pages, the customer has to download different styles and scripts. This makes every other page load longer, especially if the customer visits the site rarely.
We can improve that by creating a service worker. A service worker is a script that runs in the background even when the site is closed. It can make the app work offline, send notifications, and so on.
With Walmart, we can create a service worker that caches site resources in the background even before the user needs them. There’re multiple ways to do this; the concrete one depends on the Walmart infrastructure. A good example of one approach is available in the GoogleChrome repo.
Side note: notifications#
With service workers, we also get the ability to send notifications to customers! This should be used with caution – or we can annoy them – but this can increase engagement too. Good examples of notifications are “The product you saved for later got a discount” or “John Ford replied to your question about iPhone 8”.
To learn more, see the WebFundamentals’ guide into web push notifications.
Other ideas#
There’s still a room for further optimizations. Here’re some things that might also help – but we need to confirm that on the real app:
- Using the local storage for caching large dependencies. The local storage seems to be several times faster than the HTTP cache. We might store large dependencies in the local storage to load them quicker:https://twitter.com/iamakulov/status/981950528027611137
Update: see the Nolan Lawson’s great comment on local storage drawbacks.
- Improving the time to first byte. Occasionally, the server spends too much time serving static resources. See the long green bars? That’s the time spent waiting for the server:
These delays are non-deterministic – I’ve seen them pretty often during the analysis, but they keep happening with different resources every time – so this might be a network issue. Still, I’ve noticed them in WebPageTest results too.
-
Enabling Brotli compression. When you download a text resource from a server, the server would usually compress it with GZip and serve the compressed version. The browser will decompress it later, once received. This compression makes the text several times smaller.
Apart from GZip, there’s also Brotli – a pretty new compression algorithm which compresses text 15-20% better. Right now, all text resources on the Walmart page are compressed with GZip. It makes sense to try Brotli to see if it improves the average download time.
Bonus Increase the product image quality#
That’s kinda related to performance too.
To reduce the size of the images, Walmart compresses them on the server side. The client specifies the image dimensions it expects to receive, and the server sends the appropriate image:
https://i5.walmartimages.com/[hash].jpeg?odnHeight=&odnWidth=&odnBg=
In most cases, this is great. However, for the primary product images, this has a negative effect. When buying an expensive gadget, I often make a final decision by visiting the product page to see the gadget, to imagine how it looks in my hands. But when I come to the Walmart site, I see a low-quality image with compression artifacts:

I’d optimize this part for UX instead of performance – and serve images in a better quality. We can still keep the size difference minimal:
- Try a different encoding algorithm. WebP is 30% smaller than JPEG given the same compression level. MozJPEG is an optimized JPEG encoder that works everywhere and has significantly less compression artifacts.
- Use progressive images. Usually, during loading, images are rendered top-to-bottom: you see the top part of the image first, and then it fills
-
Use the
<picture>tag to stay compatible with different browsers. For example, we could serve WebP for Chrome and JPEG for other browsers:<picture> <source srcset="https://i5.walmartimages.com/[hash].webp?..." type="image/webp"> <img src="https://i5.walmartimages.com/[hash].jpeg?..."> </picture> - Serve Retina images with
<source srcset>. Like this:<picture> <source srcset="https://i5.walmartimages.com/[hash].webp?odnHeight=450&odnWidth=450, https://i5.walmartimages.com/[hash].webp?odnHeight=900&odnWidth=900 2x" type="image/webp" > <img src="https://i5.walmartimages.com/[hash].jpeg?odnHeight=450&odnWidth=450" srcset="https://i5.walmartimages.com/[hash].jpeg?odnHeight=900&odnWidth=900 2x" > </picture>
Summing up#
So, to optimize the product page on the Walmart site, we can:
- Fix the invisible text with
font-display: optional - Use
deferfor the large JavaScript bundle - Load non-important code with webpack’s
import - Remove polyfills in modern browsers
- Decrease render-blocking CSS
- Remove duplicated styles
- Add a service worker for caching assets in background
With these tricks, we can render the product page earlier by at least 400-600 ms. If we apply similar improvements to the whole site, we can increase orders by at least 3–6% – and help Walmart earn more.
Thanks to Jacob Groß, Vladimir Starkov, and Anton Korzunov (in no particular order) for reviewing this post.
Very good ideas, thank you. Love these kind of articles, they really help when you’re building a new website that is meant to be fast.
Hey, this is a really great article –I love deep dives like these! Most of the advice looks very solid, and hopefully will keep the Walmart folks busy for awhile. 🙂
One small correction, though: your example of storing large JS files in localStorage is problematic for a few reasons.
First off, note how Firefox implements LocalStorage: they read the entire store into memory on page navigation, meaning that the more you stuff in LocalStorage, the more you impact page load time as well as memory costs: https://www.janbambas.cz/new-faster-localstorage-in-firefox-21/. This probably explains why it’s so much faster in FF – it’s just an in-memory lookup at that point; the costs have already been paid earlier. I’m not sure about the other browsers, but I suspect it’s similar.
Second off, by not storing JS files in the HTTP cache, you lose the benefits of bytecode caching: https://blog.mozilla.org/javascript/2017/12/12/javascript-startup-bytecode-cache/ Most modern browsers do this, although their implementations may differ. Basically it means that JavaScript on the second or third page load (it depends; Chrome does it on the third page load) will already have its bytecode cached, meaning the browser doesn’t pay the cost of parsing or compiling it. You don’t get these benefits if you use localStorage rather than the standard HTTP cache. (Although note that eval() has its own in-memory cache, so you may fool yourself if you test LS+eval using something like JS Bench: https://tomdale.net/2017/07/adventures-in-microbenchmarking/)
Anyway other than that small nitpick, great post! 🙂
Thanks a lot for this great correction! Updated the article to link to it :–)
I love this detailed article. Thank you for sharing your knowledge.
I liked the ideas of analyzing the site for speeding it up, thanks!